
Why Your Power BI Dashboard Is Not Telling You the Full Story

Your finance director pulls up a Power BI report before a board meeting. The revenue figure doesn’t match what the accounting system shows. She’s not sure which one is right. The meeting starts in ten minutes.
This scenario plays out in businesses every day. You have invested in Power BI. You have dashboards, reports, and real-time visibility into your operations. Leadership can pull up a chart on demand. On paper, everything looks like progress, but the value of that visibility depends on whether the numbers behind it can be trusted.
But something still feels off. The numbers in a report do not match what your finance team sees in the source system. A slicer that should filter the whole page only affects one visual. A dashboard that took weeks to build now takes 45 seconds to load, and half the team has stopped opening it.
Declining user adoption and slow performance are usually symptoms of a deeper structural issue, and that issue is rarely the visuals themselves. It is the data model underneath them.
Every Power BI report sits on a data model: the architecture that connects your data sources, defines relationships between tables, and controls how information flows through every chart and filter on the page. When that model is designed well, your reports are fast, accurate, and easy to maintain. When it is not, every visual built on top of it is unreliable, no matter how good it looks.
In this article, we walk through four of the most common Power BI data model problems we encounter in our consulting work and explain how we approach solving them. We’ve helped businesses across sectors fix each of these, some after months of working around them, some before they cause real damage. All of them are fixable.
Problem 1: The dashboard looks fine, until someone actually uses it
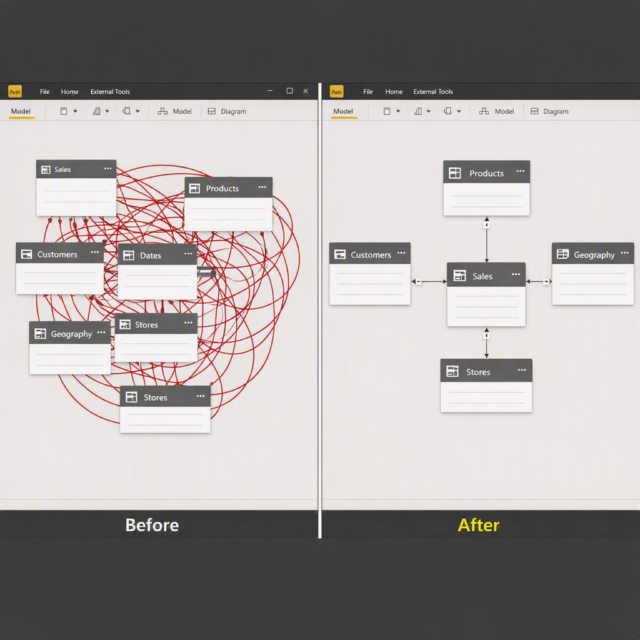
Speed is often the enemy of quality in data projects. There is pressure to get something in front of stakeholders quickly, so reports get built without a proper data model in place. Visuals are connected directly to raw data sources, business logic lives inside individual report measures, and table relationships are set up on the fly rather than planned in advance.
At first it looks fine. But as soon as someone uses the report seriously, applying filters, drilling into details, the cracks appear. Slicers that do not filter correctly. Totals that shift depending on how you look at them. Numbers that seem right until someone questions a specific figure and finds it has been wrong for months. By that point, the cost isn’t just a rebuild – it’s the decisions that were made on bad data.
The root cause is always the same: the model was never designed. It grew organically, one visual at a time, and now the whole thing is too fragile to trust and too tangled to fix incrementally.
How we fix it
We treat the data model as the first deliverable, not an afterthought. Before a single visual is built, we map how your data sources connect, where business logic should live, and how the model needs to scale. This design phase takes more time upfront, but it eliminates the most expensive problem in Power BI consulting: having to rebuild from scratch because the foundation was never solid. A proper model design typically takes a few days. A full rebuild after months of working around a broken one can take weeks.
Problem 2: Our reports are slow
A slow dashboard is not just an inconvenience – it is a trust problem. When a report takes 30 or 40 seconds to load, people stop opening it. They build their own spreadsheets or make decisions without the data. The investment in Power BI gets quietly abandoned, even if no one says so out loud. We’ve seen this happen within weeks of a new report going live.
The root cause is almost always the same: too much work is happening in the wrong place. When raw data is loaded directly into Power BI and complex calculations run at the report layer on every render, performance collapses quickly, especially with large data volumes, multiple visuals, and row-level security. We’ve seen reports with millions of unprocessed rows pulling straight into Power BI. The model technically works, but nobody can use it.
Power BI is a visualization tool, not a data transformation engine. When it is asked to do both jobs at once, it does neither well.

How we fix it
We move data preparation into the database layer, where it belongs, building optimized SQL views or stored procedures that pre-aggregate and shape the data before it reaches Power BI. The model becomes leaner, calculations simpler, and reports load in a fraction of the time. For large datasets, we also implement incremental refresh and query folding to keep performance strong as data volumes grow.
Problem 3: The numbers do not match our source system
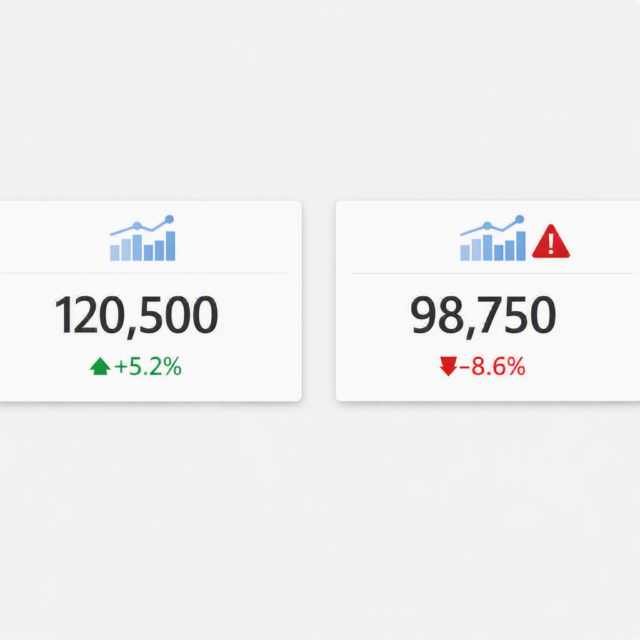
This is the most damaging problem we fix. You pull up a report and the number does not match what you see elsewhere. Revenue figures that differ from your accounting system. Customer counts that do not line up with your CRM. Inventory numbers that contradict the warehouse report.
When this happens, trust in the entire reporting environment collapses. If one number is wrong, every number is suspect. Decisions slow down or stop entirely because no one is sure which source to believe.
The cause is almost always incorrectly configured relationships in the Power BI model. When cardinality is wrong, cross-filter direction is off, or relationships are missing, the model returns wrong numbers silently – no error, just a plausible-looking figure that happens to be incorrect. This can go undetected for weeks, or longer, before someone compares figures side by side.
How we fix it
We validate every relationship against the actual source data before any report goes live, checking cardinality, filter direction, and edge cases, then reconciling totals row by row. We also document the model thoroughly so your team understands not just what the report shows, but why, and can spot anomalies themselves going forward without needing to call us every time.
Problem 4: We cannot add new data without breaking everything
One of the clearest signs of a poorly designed Power BI environment is what happens when you try to extend it. A new business unit, a new data source, a metric that has never been tracked before. In a well-built environment, these are straightforward additions. In a brittle one, they require rebuilding significant parts of the model from scratch. And the original developer, if they’re still around, often has to be involved in every change.
This happens because poorly designed models are built around specific reports rather than a flexible underlying structure. Relationships are hard-coded. Business logic is duplicated across dozens of measures. Every new requirement means unpicking something that already exists.
The result is that your Power BI environment becomes a constraint rather than an asset. The cost of adding reports is high. The risk of breaking existing ones is real.
How we fix it
We design data models using star schema principles, the industry standard for analytical data modelling. A star schema separates fact tables from dimension tables (dates, customers, products, regions) in a clean, predictable structure. Adding a metric means adding a measure. Adding a dimension means adding a table. Nothing breaks. The model grows cleanly because it was designed to grow from the start.
We also centralize business logic in the model layer rather than scattering it across individual report measures. This means that when a definition changes – say, a new way of calculating gross margin – it changes in one place and flows through every report automatically. No hunting through dozens of measures. No risk of some reports updating and others not.
What good looks like and why it matters
When a Power BI data model is built correctly, the difference is immediately noticeable. Reports load in seconds rather than minutes. The numbers match what your source systems show. Filters work the way users expect them to. New metrics and new reports can be added without disrupting what already exists.
But the most important outcome is less tangible: your team starts trusting the data. They stop cross-checking every number in a spreadsheet. They stop hedging in meetings because they are not sure whether the report is right. They start making decisions faster, with more confidence, because they know the numbers are solid.
That is what a well-built data foundation delivers. Not just faster reports, but a reporting environment your business can actually depend on.
If any of the problems described in this post sound familiar, the good news is that they are all fixable. The right starting point is a Power BI data model audit – a review of your existing environment to understand exactly what needs to change, what doesn’t, and what the most efficient path forward looks like.
Ready to fix your Power BI foundation?
We specialize in Power BI data modelling, SQL database design, and data pipeline development. Whether you are inheriting a broken environment, trying to scale a model that has outgrown its original design, or starting a new implementation and want to get the architecture right from the beginning, we can help.
We start every engagement with a clear assessment of where things stand, what is working, what is not, and what the most efficient path to a reliable reporting environment looks like. No unnecessary rebuilding. No overengineering. Just a foundation that works.
If your Power BI reports are slow, hard to trust, or difficult to scale, contact us to schedule a data model audit and identify the clearest path forward.

Oussama Bensaid
- RadixBay Consultant
- Power BI Data Analyst Associate
- HaloITSM Certified Administrator
- Salesforce Certified MuleSoft Integration Foundations
- Python Programmer Certified Entry-Level
- AWS Cloud Practitioner Certified
- Graph Developer Certified Associate
